Stock Audits
- What is a Stock Audit
- Starting a Stock Audit
- Creating Countsheets
- Importing Completed Countsheets
- Reviewing the Completed Stock Audit
- Audit Result
- Product Result
- Reports
- Deleting a Stock Audit
- Completing a Food Audit
What is a Stock Audit
A Stock Audit is a way to ensure all stock movements are being recorded correctly and all stock used is accounted for. This is also a way to ensure that all deliveries have been processed correctly.
Starting a Stock Audit
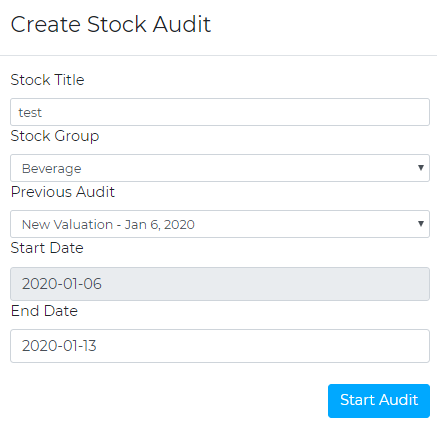
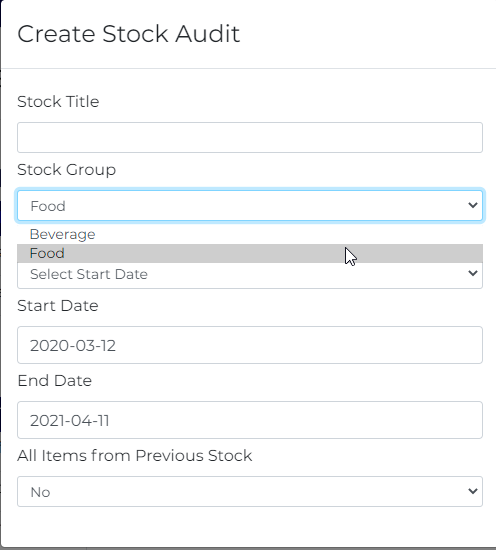
To start a Stock Audit, navigate to the Stock Audits tab on the left-hand side of the Home Screen. Then, click on the ‘Start Stock Audit’ tab in the top right-hand side. This will bring up a pop-up, where you can enter a title for the Audit, choose the correct Stock Group, select the previous Audit for a starting stock and the end date of the Audit you are processing. Once this pop up has been filled correctly, a blue button at the bottom of the pop up will appear called ‘Start Audit’. This will then put your stocktake in the ‘Open Stock Audits’ section of the Stock Audits page. This will allow you to create count sheets and import the counts.
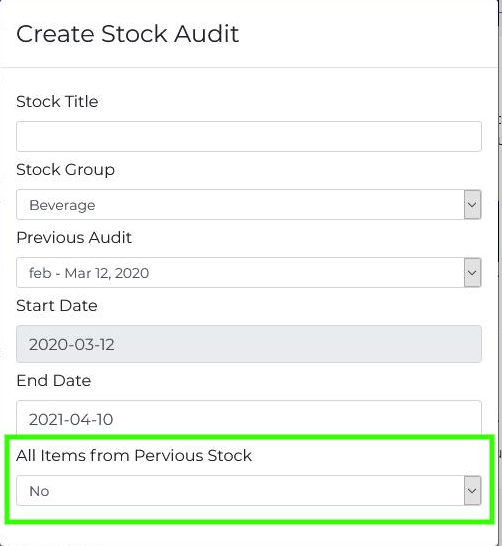
When you create the Stock Audit, you can tell the system to include all items from previous stocks, regardless of their open/closing value being zero. This will be helpful when doing food stocks as items will not drop off the countsheets.
Creating Countsheets
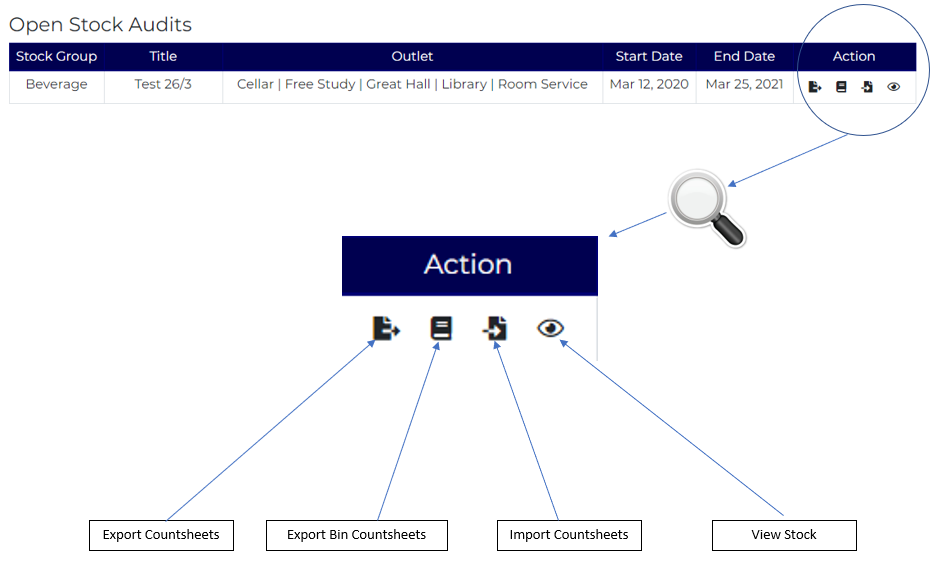
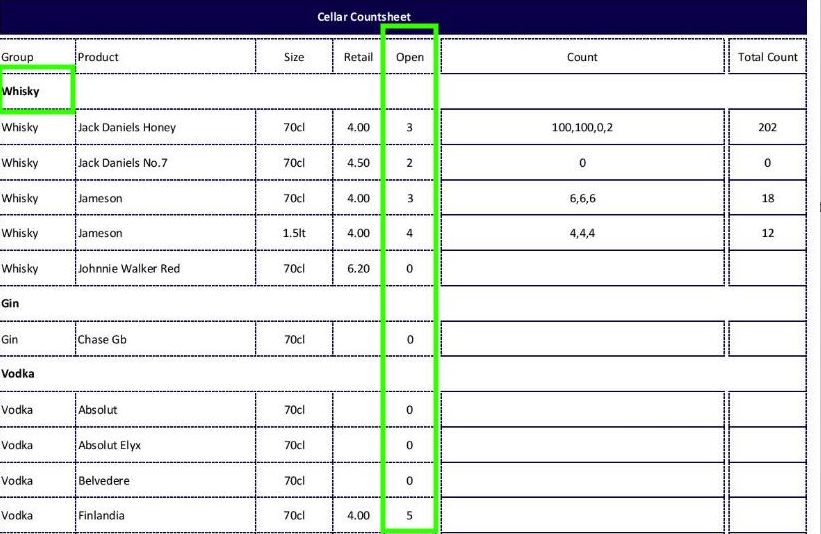
To create a countsheet, go to the relevant Stock Audit, and select the link on the right-hand side called ‘Export Count Sheets’. This will bring up the ‘Save As’ pop up. This file is to be saved in a memorable place. This will create an Excel file that will contain the countsheets for all outlets within the business. This can be printed and become your countsheets for the job. Complete the count on these sheets and type in the totals when the count is completed
Importing Completed Countsheets
Once the count has been completed and all counts are totaled on the Excel file, navigate back to the Stock Audit Screen. The link below the ‘Export Count Sheets’ link is called ‘Import Count Sheets’. When this has been selected, a pop up will appear. Use the ‘choose file’ option to upload your completed file. The upload type can be changed from ‘Appending to Existing Counts’ (If you want to add to counts) to ‘Reset All Counts’ (to enter fully new counts).
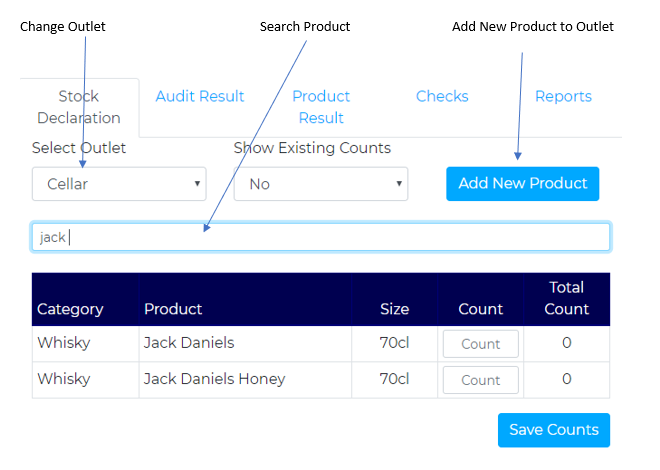
If you wish to enter the count via the online platform as opposed to using count sheets, you can do this via the 'View Stock' icon. From here you will be able to click on the 'Stock Declaration' tab at the top of the screen.
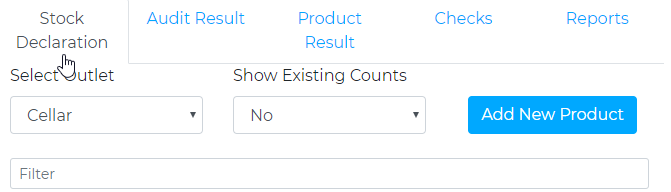
This will open all items within the outlet. From here you are able to choose the outlet, search for a product and add new products to the outlet.
Reviewing the Completed Stock Audit
When the count has been input, you can click on the ‘View Stock’ Icon (represented by an eye). This will take you to the overview of the counts. This is where you can make any amendments that are necessary as well as reviewing your entry.
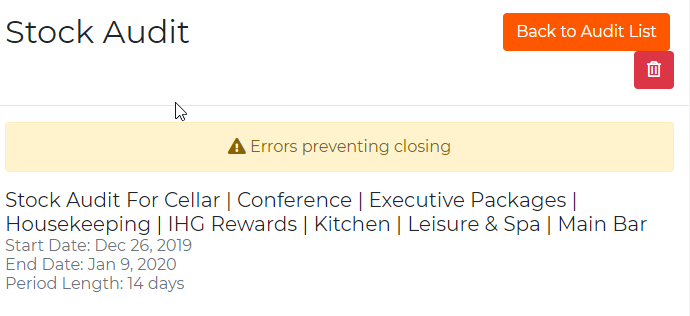
- Errors
Errors prevent the stock from being locked.If an 'error' is found, the system will display the following at the top of the screen;
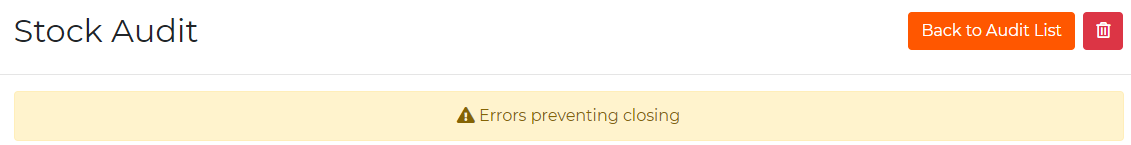
To investigate these errors, navigate to the 'Checks' Tab:
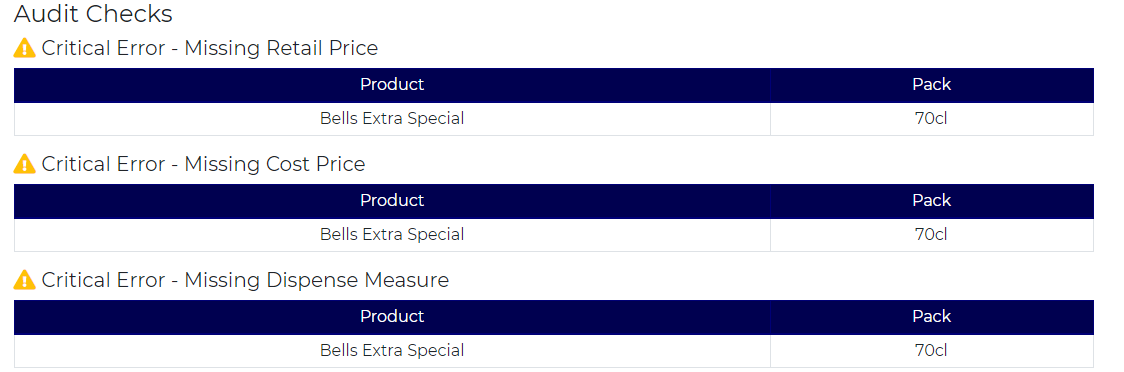
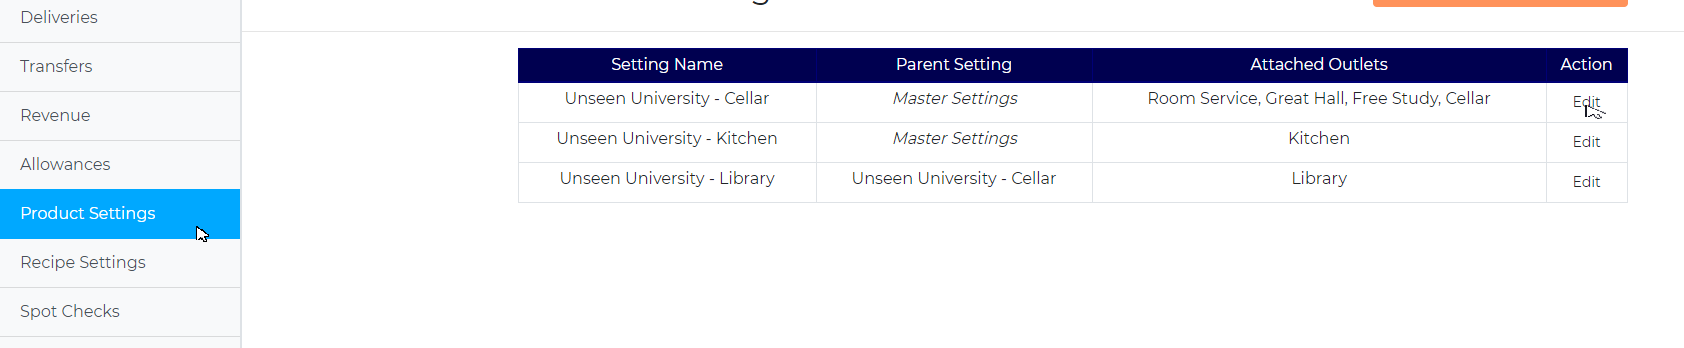
To correct the selling price and the dispense measure errors, navigate to the 'Product Settings' tab and select edit on the 'Master Settings'
This will automatically take you to the 'Retail Settings' tab. Any product within this list with missing information will be highlighted as below;

Simply enter the values and press save.
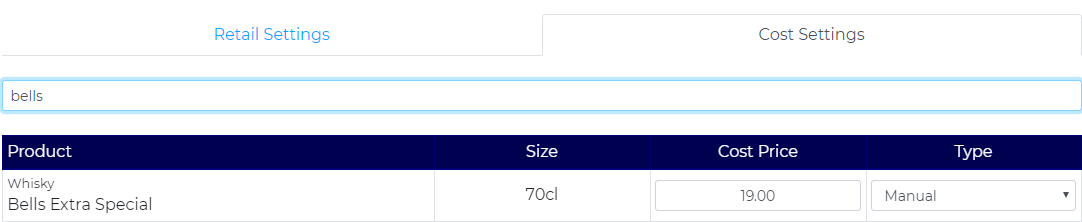
To correct the cost price, navigate to the 'Cost Settings' tab.

Search for the product you wish to update, change the 'Type' to 'Manual' and enter the cost price for the product.
The actions will clear the errors, and will enable the Stock Taker to lock the stock.
Audit Result
When you have confirmed all of the counts are correct, you are able to click on the Audit Result Tab. From here you will see four tables (as pictured).
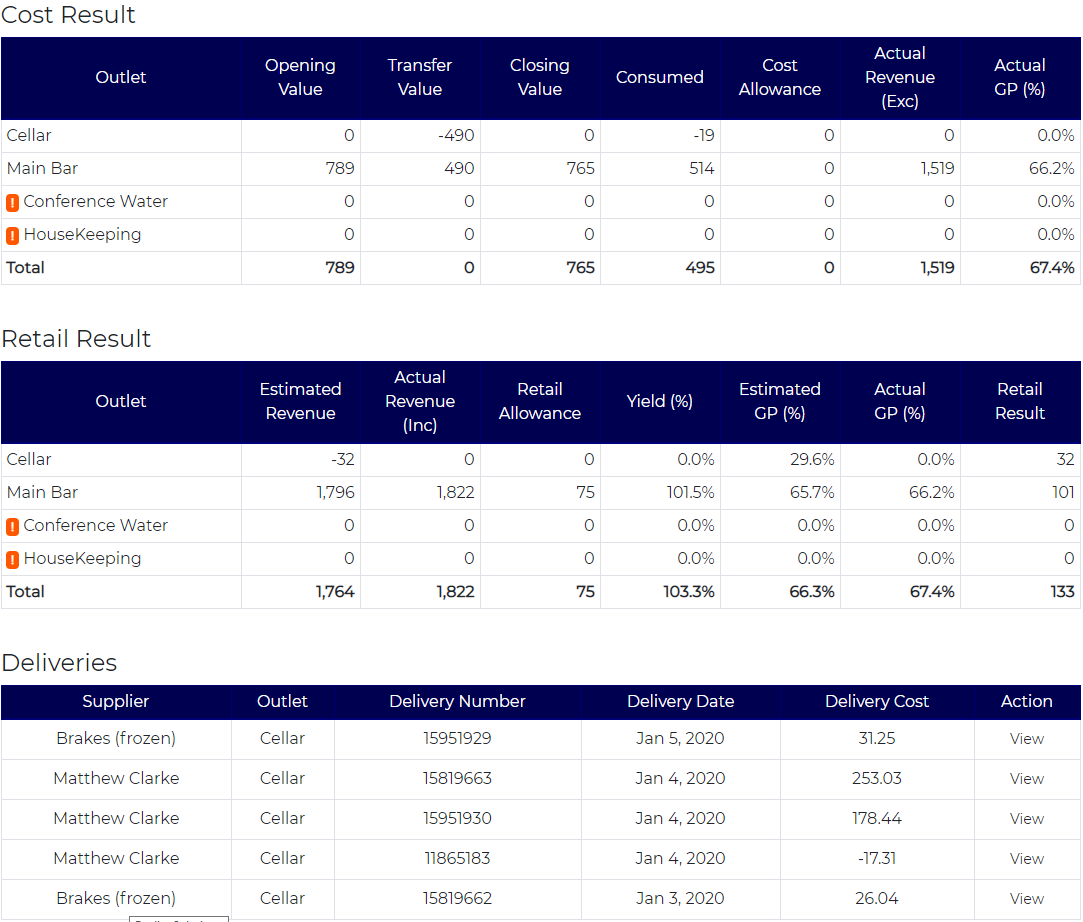
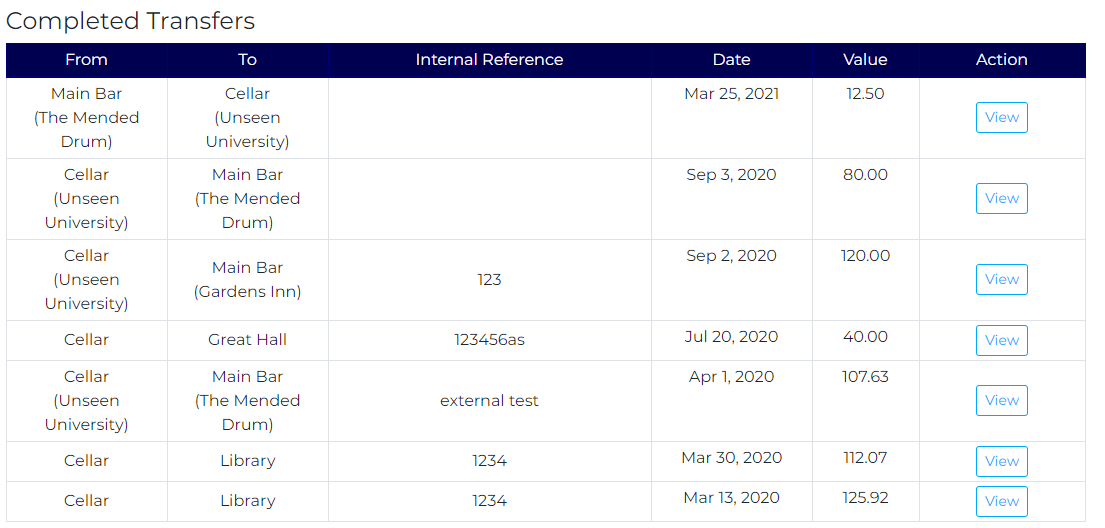
The top table is the cost result, showing transfers and consumption values. This table also shows the closing value of the inventory. The second table is the Retail result. This where you can see the surplus/deficit and GPs produced by area within the business. It also displays the Yield, and Estimated GP. The third table shows the deliveries for the current stock period. The final table shows the transfers for the relevant period.
Product Result
From the product result tab, you can see the information for each product. The headings break down each product, opening count, delivered amount, transferred amount, closing count, consumed value and estimated receipts. Here you will be able to identify any erroneous values in deliveries or transfers. You can also use this page to review your entered figures.

Reports
When reviewing the result of the Stock Take, click on the reports tab in the top-right corner.
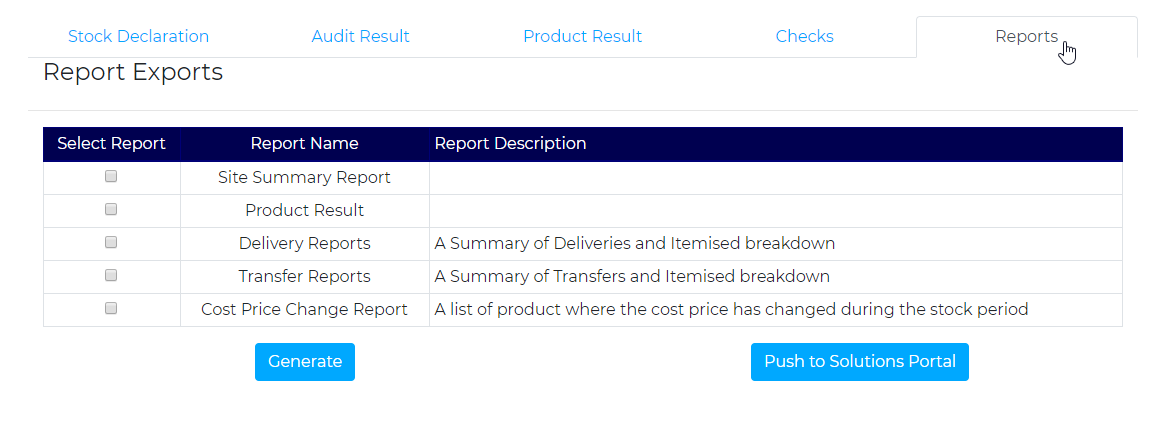
This will open up a list of the available reports for the relevant stock. Below highlights what each report is used for;
| Report | Use |
| Site Summary Report | Provides an Excel version of the result tables |
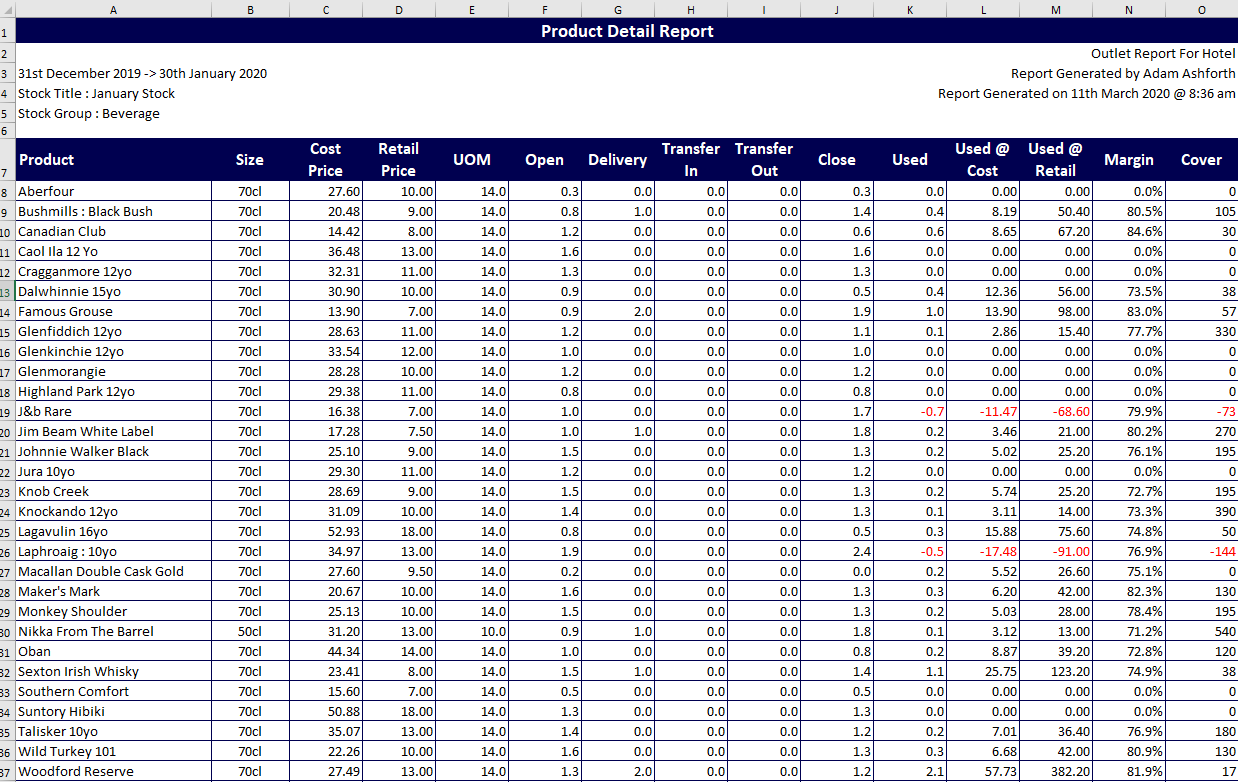
| Product Detail Report | Outlines all items with their Cost Price, Retail Price, UOM, Open/Closing counts, Deliveries and transfers. This report also highlights the SOH cover for each item and its respective GPs. A separate tab for every outlet/bar/cellar will be created |
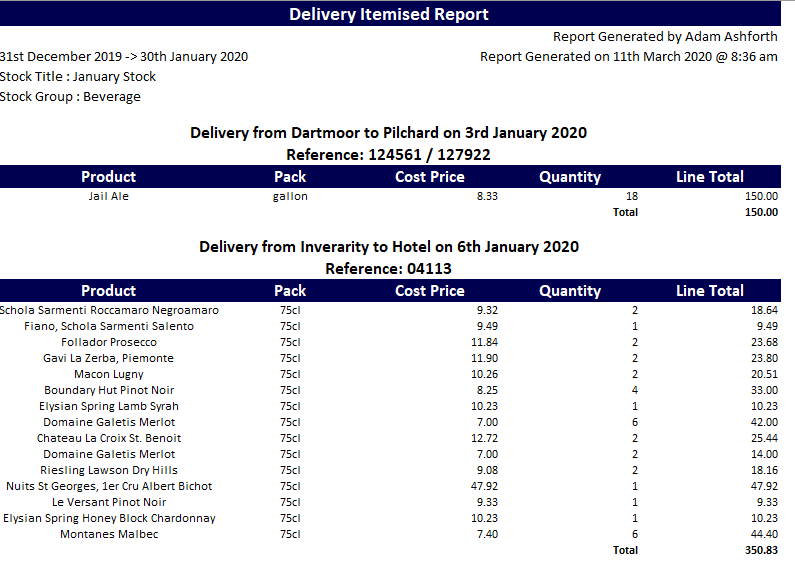
| Delivery Report | Shows all deliveries and their values for the respective period |
| Transfer Summary Report | Details all transfers within the business (i.e. requisitions) within the current period |
| Cost Price Change Report | Highlights all Cost Price Changes, with the opening cost and delivered cost. It will identify which delivery notes are associated with the change of price to aid any investigations needed. |
An example of each report is seen below;
- Site Summary Report

- Product Detail Report
- Delivery Summary

The delivery summary also creates an itemised by delivery summary tab as seen below;
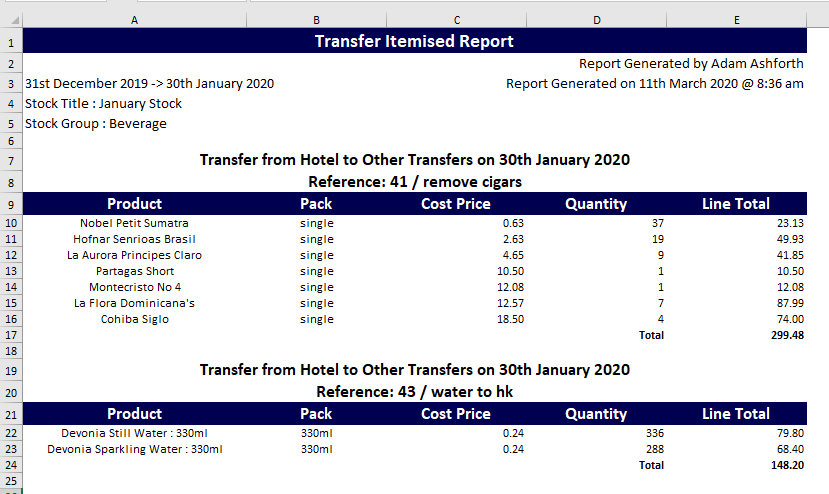
- Transfer Summary
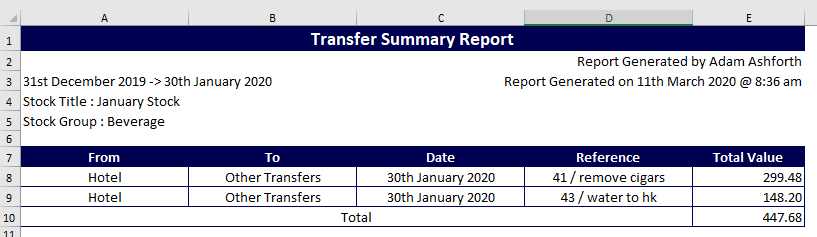
This, like the Delivery Summary, produces an itemised version also;
- Cost Price Change

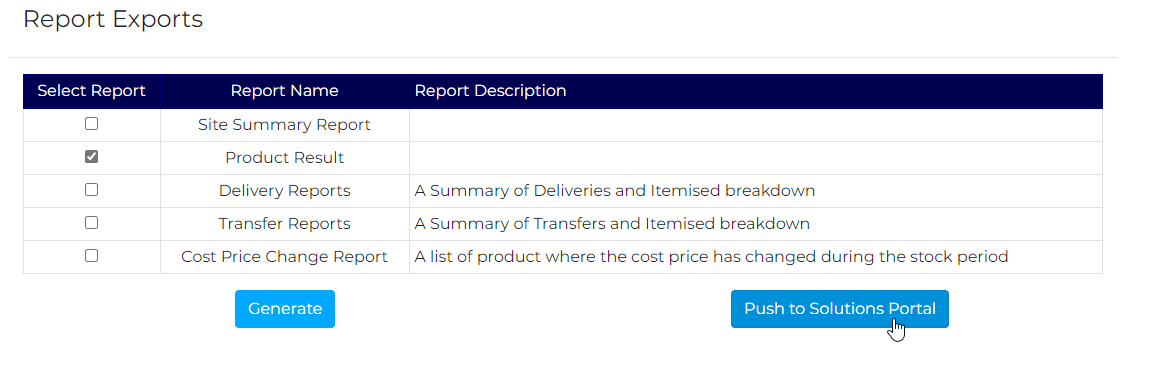
If you have access to Capcon Reality's Portal you can import the stock into the Solutions Tool Box, select the 'Product Result' report and click 'Push to Solutions Portal'.
This will then appear within the Tool Box under the user name 'System'
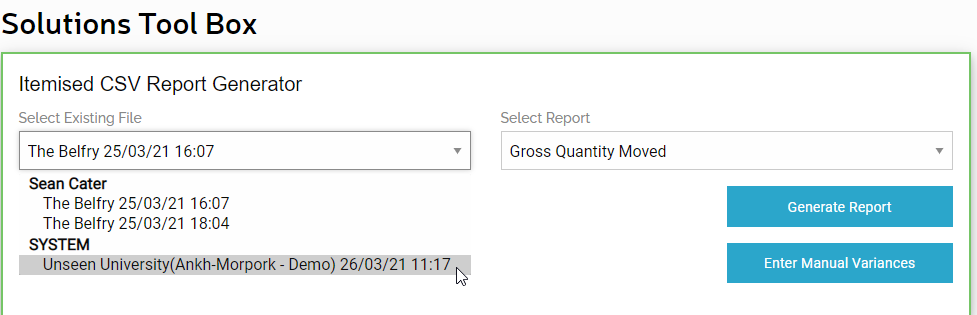
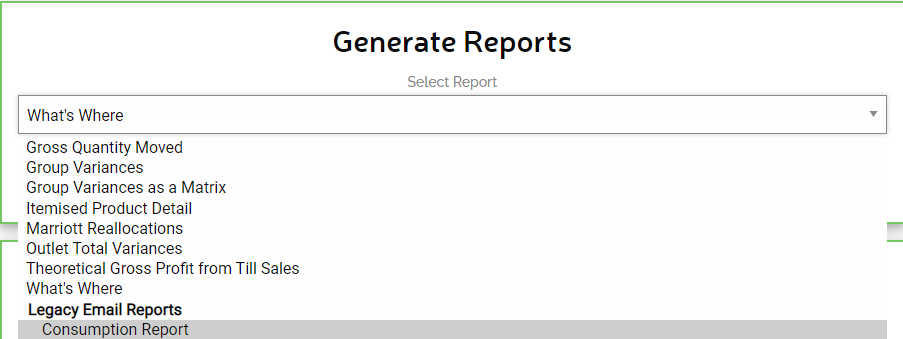
From here you will be able to access the reports listed below, as well as being able to manually enter the till sales.
Deleting a Stock Audit
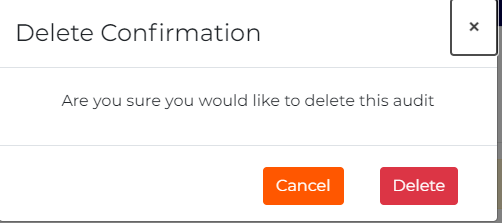
To delete and Audit, click on the bin at the top of the page.
This will then prompt a pop up confirmng the deletion of the Audit.
The deleted stock will now have disappeared from the Open Stock category on the Stock Audits page
Completing a Food Audit
To complete a food Audit, you set it up in the same way as the liquor audit, however ensure that the type of stock has been amended to select the food stock.
When setting up the stock you can include all items from the previous stock to ensure all items (even when the open/close count is zero) are available on the countsheets.
To export/import the countsheets you follow the same processes as a liquor audit.
To add deliveries, you can add the cost element of a delivery as follows:
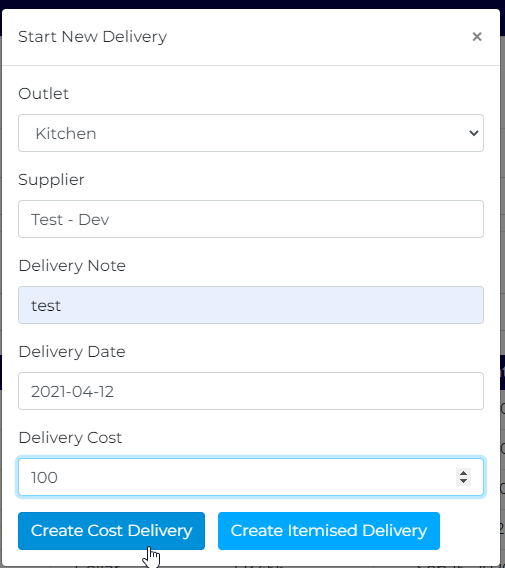
You are also able to create itemised deliveries in the same way that you create a liquor delivery.
To see the deliveries, change the stock group in the top left hand corner to the relevent area:
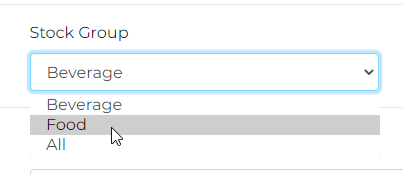
This will bring up a list of all deliveries that are associated with the relevent stock group:
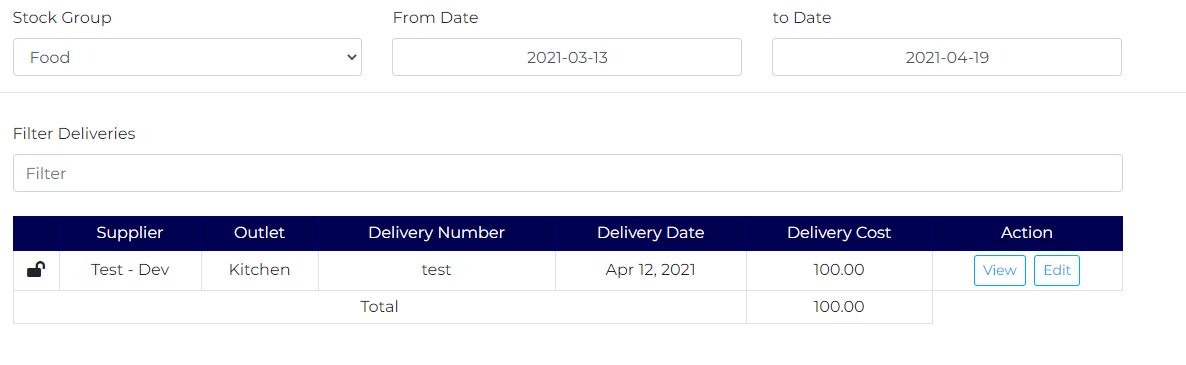
From here, you are able to view, edit and delete any delivery. You can change the date range at the top to ensure all relevent deliveries can be viewed.
To view the stock result after the count has been inputted, click on view Audit and it will come up with the following screen:
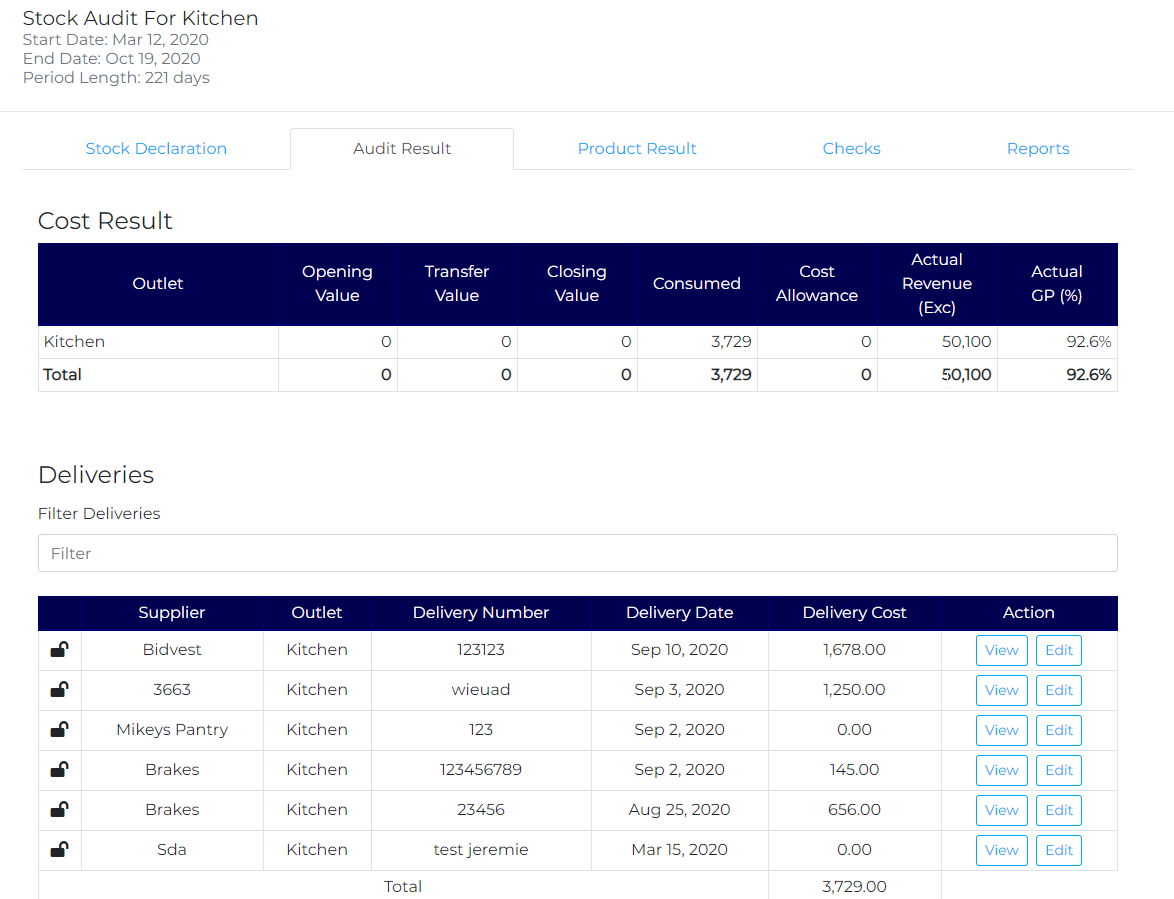
The first table shows you the breakdown of opening value, transfer value, closing value, consumption value, allowances (cost), Revenue and GP produced from the inputs.
The second table shows all deliveries that are associated with the current stock period.
The product result shows you itemised products and their opening/closing counts in order to sense check.